Thoughts on FCC SOL Results
TL;DR: While reading pass rates remained steady, pass rates in math and science are lower than in previous years. For math, the loss appears much more concentrated in Grades 6-8. The number of tests taken in all three subjects is significantly lower than previous years, partly explained by the decrease in enrollment last year. See graphs for an idea of the variation in different student groups and grade levels.
Last year was a tough year on many fronts, from mental health distress, social isolation, and confronting serious illness, among many other challenges. With the release of the Virginia Standards of Learning (SOL) results, we can now get a glimpse of the impact on student learning and find appropriate ways to address any learning loss. You can find the data here.
Things to note before moving forward:
1) Test results are not the sum total of student achievement. While they do give some measure of academic progress, test results only provide a snapshot of a limited slice of student experience.
2) Much of the literature (that I have read, so caveat emptor) on learning loss from missing school suggests students experience a large amount of catch-up growth over time (though, with variation) (there are obvious issues with applying those results to this past year). This is certainly not an automatic outcome and is the product of extra resources put into appropriate interventions.
3) There has been a lot of discussion in the national news about the “Covid slide” in student academic achievement. While Covid has had a large impact on students nationwide, when thinking about appropriate interventions for students in Falls Church City, we need to focus specifically on our children and what they require.
4) Many students in our community suffered greatly (academic performance maybe being the least of their worries) last year, but while I do sometimes think we talk too much about student resilience (which risks minimizing their experiences), I think this article (shared by Dr. Noonan a while back) provides a useful perspective on the narratives we use when talking about students’ academic performance. We need to ensure that we are providing students the opportunity to thrive through appropriate academic challenges.
On to the data!
The state provides division level data files that cover three subject areas for the spring of 2021: reading, mathematics, and science. Below are the results for all students in FCCPS for these subject areas. The red line represents the average pass rate for the tests taken from the spring of 2014 through the spring of 2019. There were no SOLs in the spring of 2020 (for obvious reasons). The overall spring 2021 pass rate for reading is close to the average of the previous years; the pass rate for math is about 6 percent below the average of previous years; and the pass rate for science is about 8 percent below the average of previous years.
Note: in the spring of 2019, there were 1,357 reading test scores, 1,596 math test scores, and 859 science test scores. For the spring of 2021, there were 1,264 reading scores, 1,265 math scores, and 611 science scores. For grades 3-12, there were 2,023 enrolled at the end of the 2018-19 school year. There were 1,979 students enrolled at the end of the 2020-21 school year.
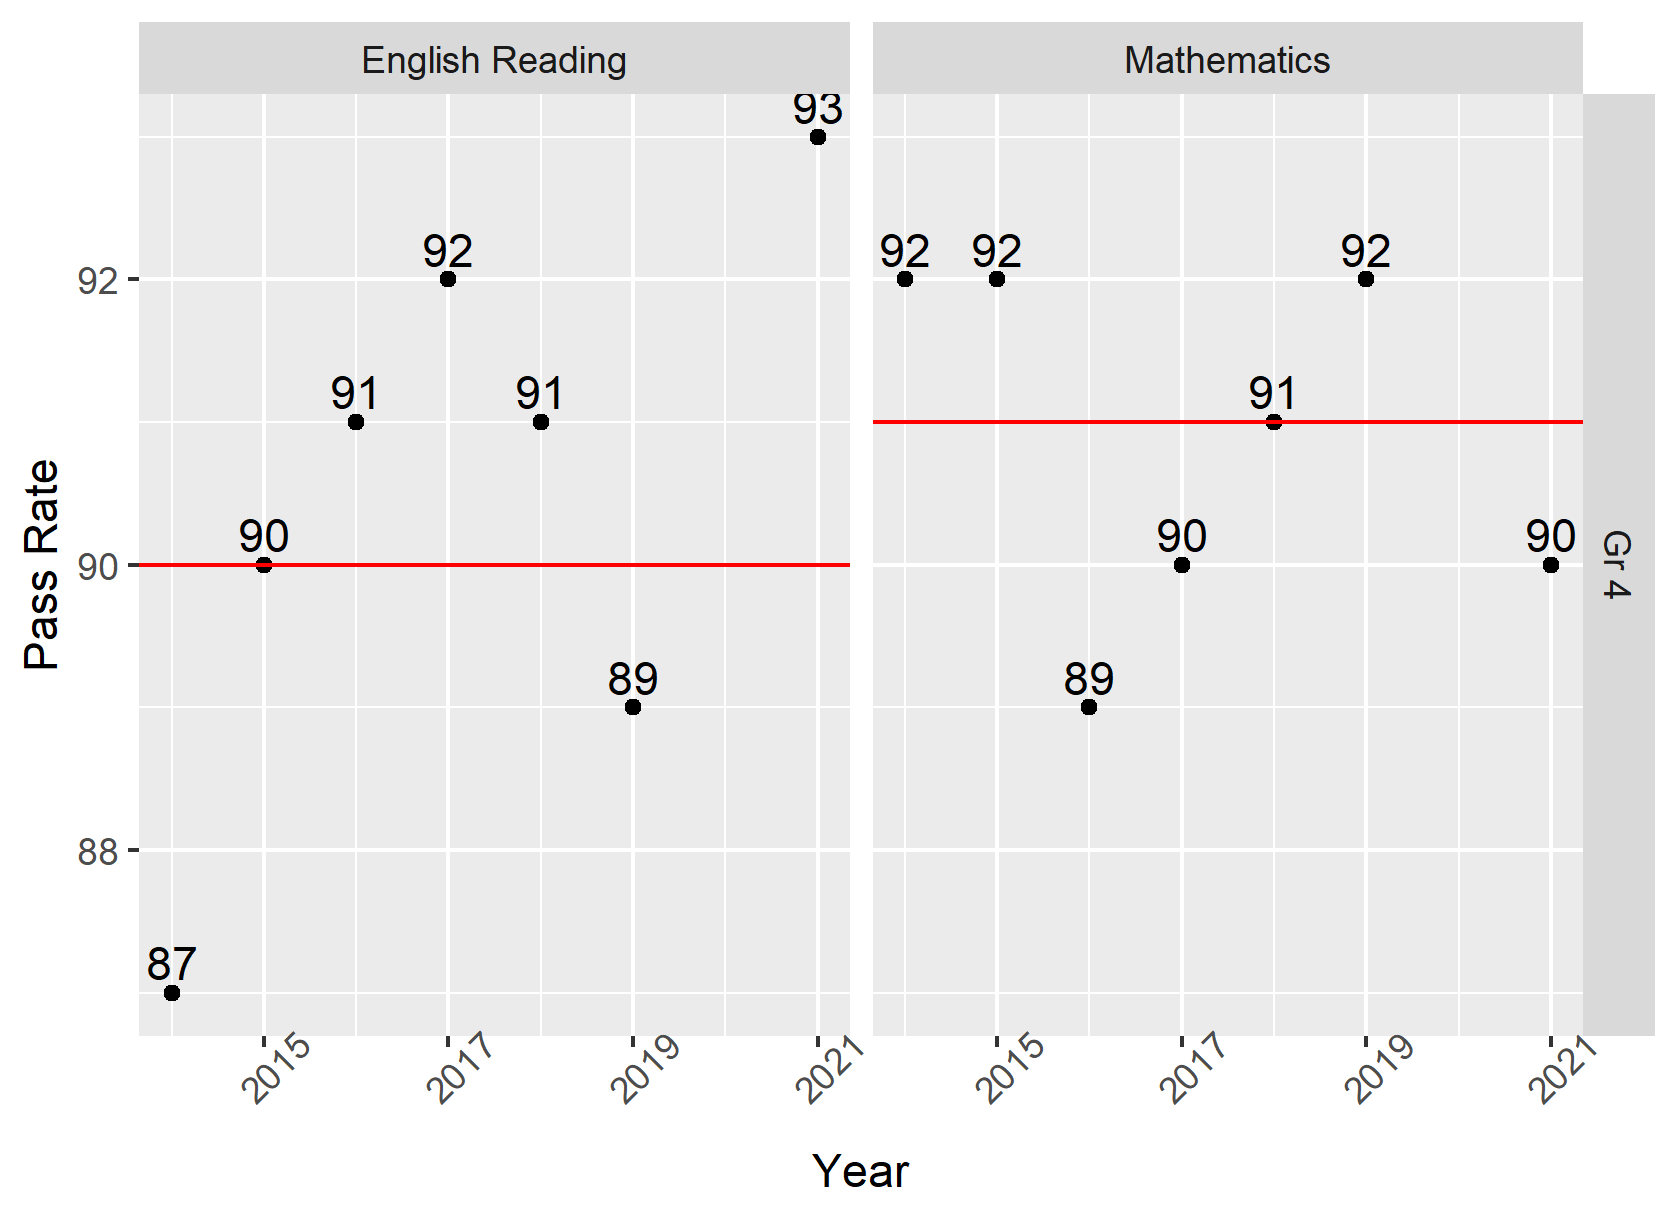
As with all averages, a lot of variation is masked in the overall pass rates. Below, I have provided the pass rate data for each demographic group reported by Virginia. Almost all groups show the same trend as the overall results (steady reading pass rates but lower math and science pass rates) but with varying magnitudes. I have also included the results by grade level (including the end of course tests taken in high school). I’ll focus on math and reading for grades 3 through 8. Fewer grades take a science SOL exam and some end of course exams had large variance from prior years in terms of the number of students taking those exams. For grades 3-5, the reading and math pass rates bounce around the average over the years, and the spring of 2021 pass rates are within what appears to be a normal range. For grades 6-8, the reading pass rates are close to the average of the previous few years, but the math pass rates are notably below the average of previous years. If you are interested, you can build your own table here (all numbers for completed exams come from this source).
Caveats:
1) I have presented only overall pass rates and not individual trajectories of academic progress. FCCPS has that data and can identify those students who require extra resources and provide the appropriate intervention.
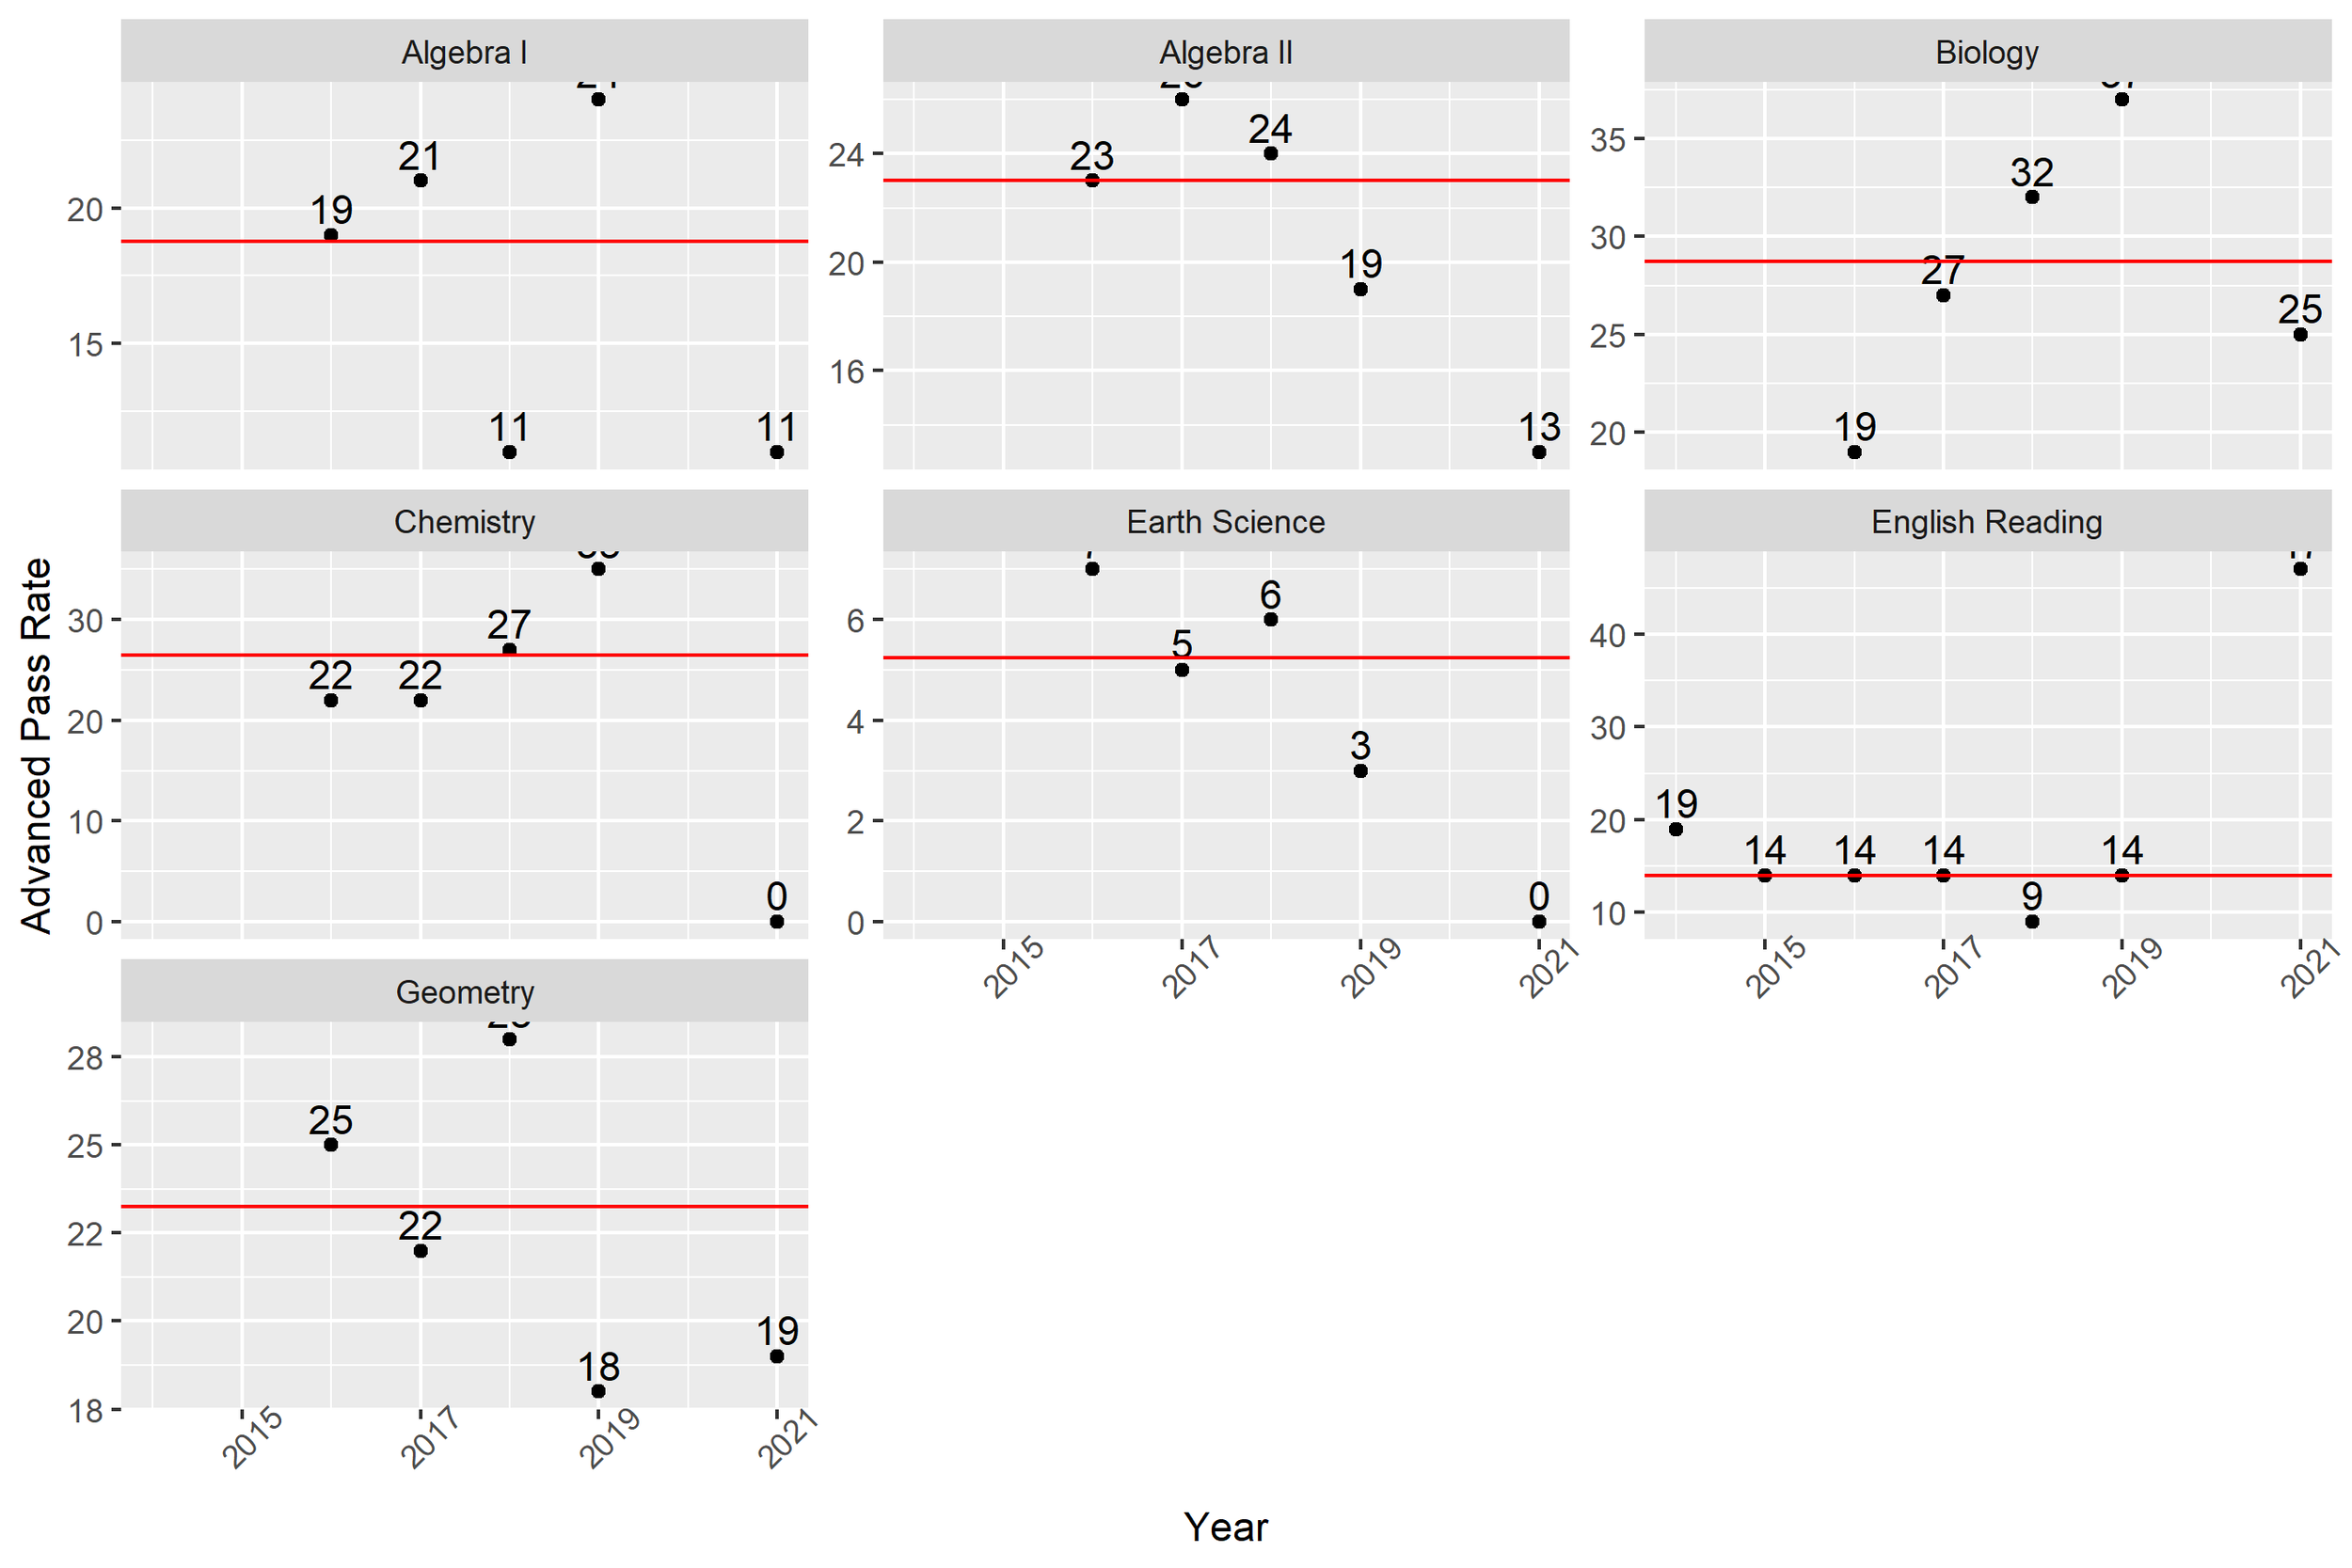
2) Only pass rates are presented, which are themselves the product of aggregation. As a board member, I would probably request annual distributions of the actual scores to get a sense of both the actual average performance and variation within and across years). It is possible that even with steady reading pass rates, overall scores can decrease. Looking at the advanced pass rate data (presented below), while most grades maintained pass rates in the usual range, grades 3 and 5 had lower advanced pass rates while grade 4 had a higher advanced pass rate than previous years. This highlights the importance of the board receiving the score distributions in order to better understand the data.
3) If the analysis has to be aggregated, a cohort analysis would be preferable (that would allow a bit better visualization of academic performance over time). You can kind of do that with the data below by, for example, looking at grade 4 pass rates in the spring of 2019 and comparing them to grade 6 pass rates in the spring of 2021 (noting that some students will have left that cohort while others would have entered it over the 2 year time span).
4) The number of observations vary year-by-year. I have only provided results for tests included in the state-provided data file for the 2020-21 school year because the number of students taking some tests in the spring of 2021 was significantly below the number of tests taken in previous. For example, the average number of students taking the writing SOL from spring 2013 to spring 2019 was 410, but only 216 students sat for the writing SOL in the spring of 2021 (383 students took a writing SOL in the spring of 2019). That suggests that the 2021 results are not comparable to previous years for the writing SOL. Some of the end of course tests presented below also experienced large decreases in tests taken (for example, there were 195 Algebra 2 tests completed in the spring of 2019 but only 45 completed in the spring of 2021), and I only include the end of course exams because they were also included in the data files.
5) (Edit added September 14, 2021): Please also note the scale on the y-axis changes for each subgroup and grade. The y-axis is also truncated and is not 0-100.
6) (Edit added October 6, 2021): The pass rates in the 2016-2017 academic year for English learners are much higher than in subsequent years. It appears that pass rates in the data provided for that year were calculated using scores from both English learners and former English learners (i.e., students who were English learners and are no longer categorized as such). The data provided by VDOE for the 2018, 2019, and 2021 SOLs does not include former English learners in the calculation. This is a topic that would benefit from more analysis. How many English learner students move out of that category in any given year? Upon entry into FCCPS, how long do students remain in the category of English learner? If the district has the data to easily separate the current and former English learners, it would be helpful to see those groups analyzed separately.
Side note: In addition to previous literature on learning loss from missing school showing catch-up growth, that literature also shows that reading scores tend to suffer less than math scores (which is consistent with the current SOL data for Falls Church City). I imagine that pattern is the result of reading practice (rather than math) being more prevalent across subjects (i.e. you have to read for history, literature, science, etc., but you don’t usually have to do math in history or literature). If anyone (particularly educators) knows of a good discussion of these data patterns and how math instruction might be modified (if at all) in light of the findings, feel free to contact me.
I look forward to FCCPS presenting a more detailed analysis to the board soon.